
Is the light vehicle fleet dirty?
/Government says transport is dirty and exhaust emissions are worsening – yet the new vehicle industry says it’s cleaning up.

The new car industry says emissions from new vehicles are falling. The situation for the national fleet, though, is less rosy.
CONTENTION transport emissions are worsening and that ‘dirty’ vehicles with high exhaust emissions are continuing to be sold is irking the new vehicle industry.
It says average CO2 emissions from new vehicles have been reducing annually for at least 15 years; the count cited for the light vehicle fleet – passenger cars, sports utilities, vans and one-tonne utes - as of the end of last year was 174.3 grams per kilometre. That’s 21 percent lower than for 2006, when the average was 220.7 grams per kilometre.
There’s no credit for this effort, say the vehicle distributors. If anything, Government officials keep alleging transport is dirty.
Why?
“It is all to do with what you are quoting,” says Motor Industry Association chief executive David Crawford.
“Officials and government ministers keep quoting total emissions from the transport sector, not average emissions.
“Yet they’re imposing a vehicle emission standard based on average emissions.”
Total emissions are continuing to rise. According to Crawford, that’s not because the vehicles continue to be dirty. He cites high numbers of people coming to New Zealand – immigrants pre-Covid, a big count of Kiwi returnees since the virus impacted globally - and growth in per capita vehicle ownership.
Vehicle ownership in this country is among the highest in the world, currently sitting at 0.90 vehicles for every New Zealander.
It is highest in the Nelson-Tasman-Marlborough region where per capita ownership is 1.01 vehicles, closely followed by 0.94 vehicles in both Canterbury and Southland. At the other end of the scale are Wellington and Gisborne, with the lowest vehicle ownership at 0.69 vehicles for every person.
And here’s another telling statistic: The number of households with access to multiple vehicles is also growing.
While the number of households with either no vehicle or one vehicle is reducing (going down from 116,382 and 552,813 respectively in 2013 to 100,302 and 514,994 at the last Census), households with access to two and three or more vehicles is growing.
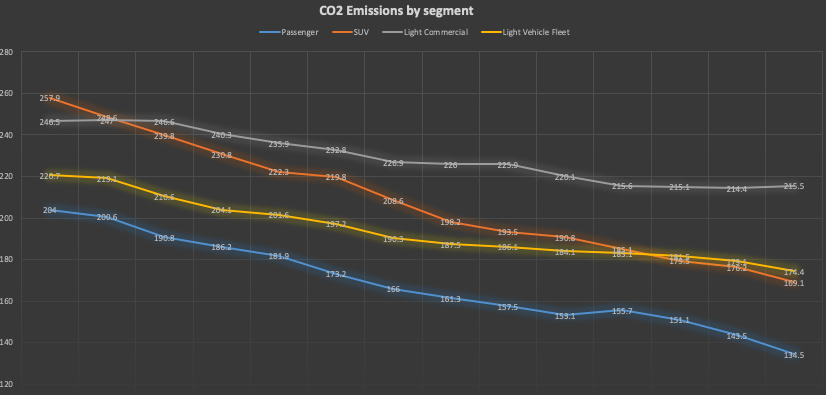
The Motor Industry Association has produced this graph showing how individual categories are showing improvement.
In 2001 there were 463,116 households with two vehicles. This had grown to 531,027 in the 2006 Census, then to 565,095 in 2013, and up to 598,992 in 2019. Meanwhile in 2013 there was 237,468 households with access to three or more vehicles, and by 2019 this had grown to 303,942 vehicles.
It is fully expected that by this year the numbers of no vehicle or one vehicle households will have continued to fall, and those with multiple vehicles will have continued to sharply rise.
“If the size of the vehicle pie keeps growing, then total emissions may not reduce,” says Crawford.
“We’d probably need to reduce the number of vehicles on our roads – which would be hard to do with high immigration numbers and the New Zealand population growing. So not only has our rate of ownership increased, but our population has also grown. It’s a double-whammy.”
And while this growing population and increasing vehicle ownership scenario is playing out, average CO2 emissions from New Zealand’s light vehicle fleet are continuing to go down.
Fifteen years ago when average emissions were 220.7 g/km, only the very smallest vehicles in the Micro category had CO2 counts lower than the industry average of today.
Back then the Micro vehicles emitted an average of 153.1 g/km. Next up were Light vehicles with an average of 185.8 g/km, and all the remaining categories were over 200 g/km, topping out with Upper Large vehicles with their average of 281.7 g/km.
By last year the average had reduced every year to reached a new low of 174.3 g/km, with the Medium category leading the way on 114.7 g/km, followed by Light (121.1 g/km), Micro (122.9 g/km), and Small (126.5 g/km).
The Upper Large vehicles continued to be highest emitters even though their average had fallen substantially to 235.3 g/km, and Light Buses were next with 234.5 g/km. The big-selling Sports Utility Vehicles had reduced their emissions to an average of 165 g/km, and even utes – currently the subject of so much controversy for their being ‘dirty’ – had fallen from 249.1 g/km in 2006 to 216.9 g/km in 2020.
“Essentially all that data shows that our new vehicles are on average producing fewer emissions year on year,” says Crawford. He admits though that the rate of drop for utes has flattened out in recent years.
“But on a sales weighted basis the average is coming down. It’ll come down a lot further too, as more and more electric vehicles are being added to the mix.”